FREE USPS Ground Advantage SHIPPING in the Continental U.S. only.
Trade with more structure, more awareness, and far less guesswork.
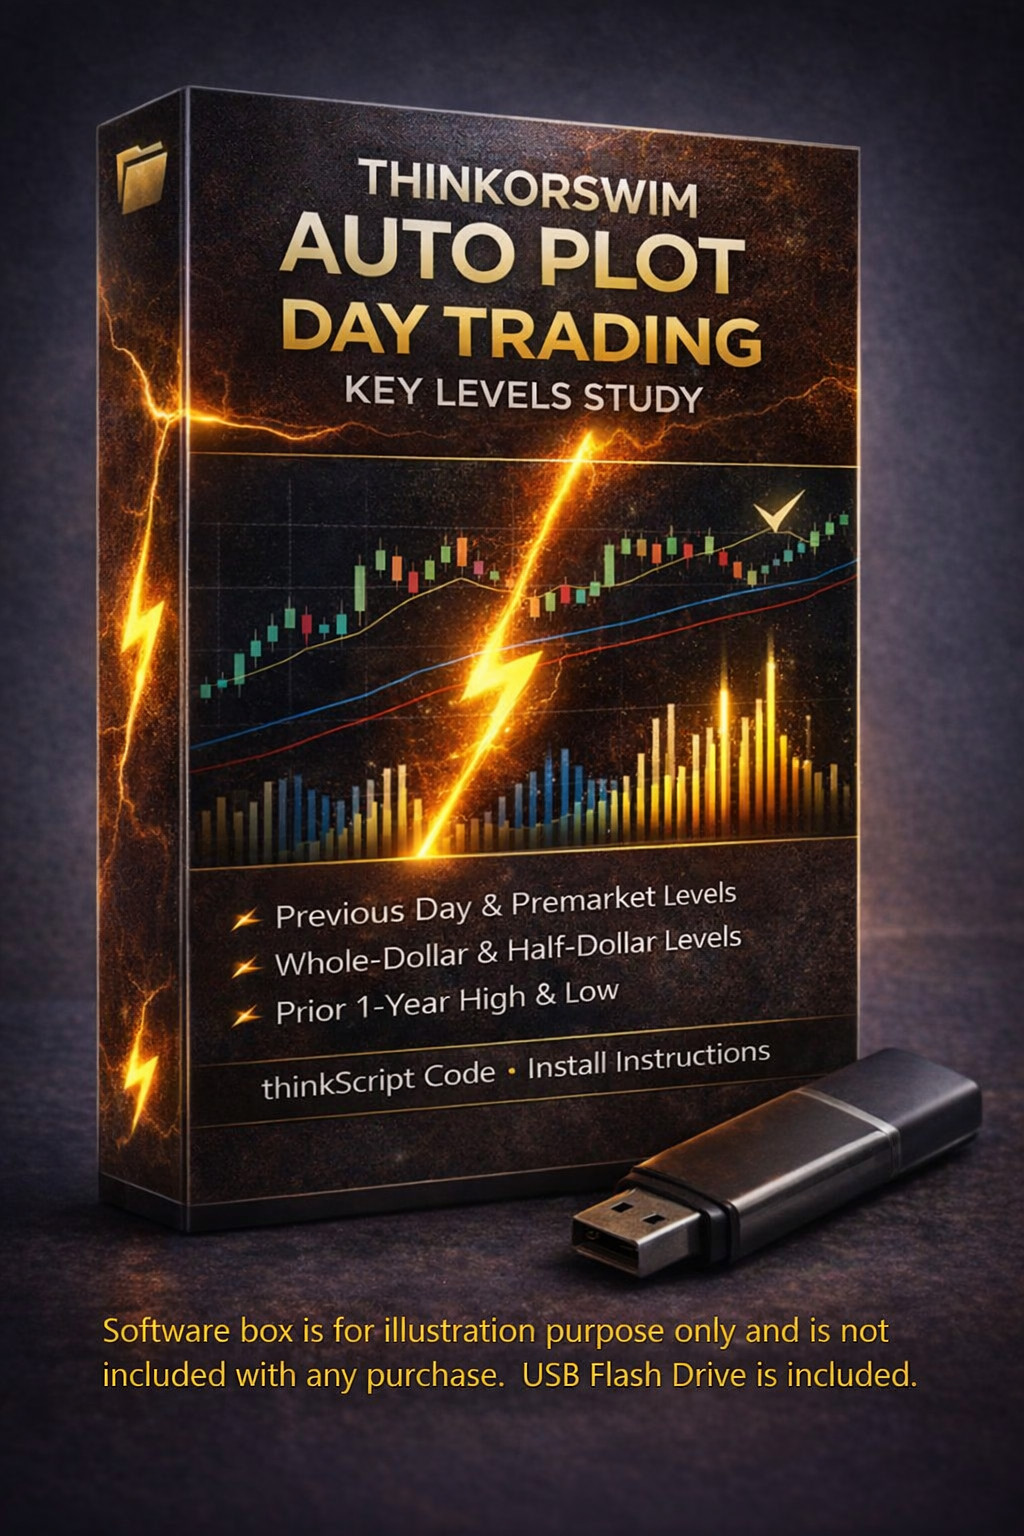
This custom Thinkorswim Auto Plot Day Trading Key Levels Study is designed to automatically plot the key price levels that traders watch most closely during the trading day. Instead of filling your chart with lagging indicators or cluttered signal tools, this study keeps the focus on what matters most: important reference lines that help you understand where price may react, stall, reject, break, reclaim, or accelerate.
This is not a buy-arrow or sell-arrow study.
It does not generate entry arrows, exit arrows, or trade signals.
Its purpose is to automatically plot important price lines / key levels directly on the chart so you can make better-informed trading decisions using structure and location and to save you time from manually plotting them everyday.
The following will automatically be plotted:
- Previous Day High / Low / Close
- Today’s Pre-Market High / Low
- Whole-Dollar and Half-Dollar price levels
- 1-Year High / Low
- Also, optional chart bubbles for everything above except for Whole & Half Dollars (chart bubbles are visible with the most current candle only)
Quick Thinkorswim Note:
Some plotted levels, especially 1-Year and round-number levels, can vary slightly due to Thinkorswim chart aggregation and session behavior.
A Major Time-Saver for Active Traders
This study can save a significant amount of time by automatically plotting the key levels many traders would otherwise have to draw manually themselves. Instead of repeatedly marking previous day highs and lows, pre-market structure, prior close, round-number levels, and yearly reference points on every chart, the study does that work for you automatically. That makes pre-market prep faster, chart review cleaner, and multi-stock analysis much more efficient. For traders who look at many charts each day, that saved time and consistency can be a major advantage.
The original code structure is built as an intraday key-level overlay with toggles for prior-day levels, pre-market levels, round levels, line weights, and optional bubbles, and it is explicitly intended for intraday charts.
Important Reminder
This study is designed to help you read the chart more effectively by automatically plotting important reference lines. It is a chart-structure and key-level tool, not a promise of profits and not a signal generator. Best results come from combining these levels with your own trading strategy, confirmations, and risk management.
PLEASE READ BEFORE BUYING – Important Thinkorswim Limitations / Data / Charting Notes
This study is designed to work properly inside Thinkorswim, but certain plotted levels depend on the platform’s chart data, aggregation methods, and session settings. Please understand the following before buying:
1) This study plots key levels / reference lines — not trade signals
This is not a buy-arrow or sell-arrow study. It does not generate entry or exit signals. It is a chart-structure tool designed to automatically plot important price levels on the chart.
2) 1-Year High / Low is based on Thinkorswim daily-bar data
The 1-Year High / Low in this study is calculated using Thinkorswim daily-bar data and a rolling trading-day lookback. Thinkorswim’s visible “1 Year” chart view is not always the exact same as a strict 252-trading-day calculation. Because of that, the plotted 1-Year High / Low on intraday timeframes may sometimes come from a daily candle that is several trading days outside what appears obvious on the visible 1-Year chart window. As a result, the study’s 1-Year High / Low may not always exactly match what a trader expects from simply viewing the standard Thinkorswim 1-Year chart. This is normal platform/chart-view behavior and does not indicate a defect in the study.
3) The source candle for a 1-Year High / Low may not always be obvious on a standard 1-Year chart
In some cases, the daily candle responsible for the plotted 1-Year High or Low may be easier to identify on a longer chart view, such as a 2-Year chart. This is normal and does not indicate a problem with the study.
4) Previous Day High / Low / Close is based on the prior daily bar
Previous Day levels are pulled from the prior daily bar in Thinkorswim. Because of that, they may not always perfectly match grouped intraday candles such as 30-minute or 1-hour candles, especially when extended-hours data is enabled or when comparing different intraday aggregations.
5) Whole-Dollar / Half-Dollar levels are tied to the latest completed candle
Round-number levels are anchored to the most recent completed bar and are intended for current trading context. Because of that, they may not remain meaningfully plotted when scrolling far back in chart history. This is expected behavior by design and does not indicate any problem with the study.
6) Minor differences can occur because of Thinkorswim platform behavior
Small variations can happen because of:
- intraday vs. daily aggregation differences
- extended-hours vs. regular-session chart settings
- trade corrections or vendor data adjustments
- rolling lookback behavior
These are normal Thinkorswim/platform limitations and do not indicate a defect in the study.
Important Overall Chart Display Note:
Some key levels may occasionally appear stacked, clustered, or very close together. This is expected behavior and not a defect in the study. It happens when multiple valid reference levels are located near the same price zone. This can be more noticeable on higher-priced stocks, lower timeframes, or when the chart is vertically compressed. In these situations, the study is correctly plotting all enabled levels, which may visually create a tighter grouping of lines.
Key Features
- Auto plots important day trading key levels
- Previous Day RTH High / Low / Close
- Today’s Pre-market High / Low
- Whole-Dollar and Half-Dollar Levels
- Prior 1-Year High / Low
- Adjustable line weights
- Adjustable level visibility
- Optional bubbles
- Clean chart overlay design
- Built specifically for Thinkorswim intraday use
If you want a cleaner way to see where price is most likely to react — without manually drawing level after level yourself — this study can become an extremely useful part of your daily chart setup.
It automatically plots the important lines.
It helps you understand where price is trading.
And it gives you the structural context many traders miss.
The real edge is in the overlap -The biggest benefit is not just each level individually — it is what happens when they start to line up.When levels cluster together, the area often becomes much more important.
Examples:
- previous day high lining up near a Whole-Dollar level
- pre-market high sitting near a prior 1-year high
- previous day close lining up with a half-dollar support area
- multiple levels stacking into one tight zone
Those stacked levels can create the exact price areas where a stock either launches, rejects hard, pauses, or traps traders. This study helps you spot those high-interest zones quickly and visually.
Have the confidence to trade with more structure, more clarity, and far less guesswork.
What You’ll Receive with This Purchase
This purchase includes 1 USB Flash Drive with everything you need to install, understand, and be able to use this custom studyon Thinkorswim.
- ThinkScript Code File -The full, editable ThinkScript for theKey Level Automatic Plotting Custom Study.
- Installation Guide (Step-by-Step) -Clear instructions on how to import the custom study into Thinkorswim.
- Read Me File -What the indicator does (and what it does NOT do). Core logic behindthis custom study, Important usage (READ BEFORE BUYING)***********************
- You will be receiving aUSB-A flash drive with this purchase. USB-A flash drive works inUSB 3.0 and USB 2.0ports (backward compatible). If your computer only hasUSB-Cports, you may need a USB-C to USB-A adapter (not included).
You must already have anactive thinkorswim® account(Schwab / TD Ameritrade). Platform access isnotincluded.
This indicator is for thethinkorswim desktop platform only(not mobile, not other brokers/platforms).
Buyers should already bereasonably familiar with thinkorswim, including how to:
For best results:
Back-test or paper tradethis custom indicator with your own strategy. Re-tune inputs as markets change.
Test the custom indicator thoroughlyto ensure it fits your trading style and that it behaves the way you expect to fit your strategy.
- There isno single “magicsetting”that works perfectly on every ticker and timeframe.
TRADING IS RISKY, SO ALWAYS use proper & safe risk management.Trade with a defined risk level (stop loss or max dollar risk). Never risk money you cannot afford to lose.
Important Platform Reminder
Some plotted levels — especially 1-Year High / Low and Previous Day levels — may not always visually match every intraday chart view exactly because Thinkorswim uses different aggregation methods for daily and intraday data. Whole-Dollar / Half-Dollar levels are designed for current price context and may not remain meaningful when scrolling far back in chart history.Important DisclaimerLike any custom study on Thinkorswim, minor plotting differences can occasionally occur due to platform data, aggregation, session settings, and charting limitations.There are no guarantees of profit, accuracy, or performance. Past performance is not indicative of future results.
This product is provided for educational and informational purposes only and does not constitute financial, investment, or trading advice.
TRADING IS RISKY - You are solely responsible for your own trading decisions, parameter choices, position sizing, and risk management. Trading involves substantial risk and can result in loss of capital.
thinkorswim® and any broker names mentioned are trademarks of their respective owners. This product is not affiliated with, endorsed by, or sponsored by Schwab, TD Ameritrade, or any broker.
This indicator is provided for educational and informational purposes only. It is not financial advice. The seller/creator cannot and does not accept any responsibility for trading losses or damages of any kind that may result from its use. You are fully responsible for your own trades and risk.You are solely responsible for your own trading decisions, position sizing, and risk management. It is strongly recommended that you always trade with a clearly defined risk level (such as a stop loss or maximum loss per trade). The seller/creator cannot be held responsible for any trading losses or damages that may occur from the use of this indicator.